

As part of the BMBF founded project FORESTCARE we have developed SynForest, an application that generates high-quality point cloud datasets of synthetic forests. For this purpose, we aimed to produce realistic patterns by combining forest growth simulation tools such as ForestFactory2 with tree shape modeling based on real data from existing databases such as PyTreeDB3. Additionally, the scanning method, trajectory, and sensor properties are simulated in Helios++4 to approximate real imaging techniques.
SynForest is able to utilize the power of our HPC cluster by distributing the task among nodes and achieves efficiency through parallelism for arbitrarily large datasets. Our results show that the synthetic datasets closely resemble real-world data and therefore SynForest can be regarded as a practical and cost-effective alternative for the study of large-scale forest environments and tree structures, with many potential applications in forestry, deep learning and data analysis.
Intro
Point cloud data is commonly used to describe the 3D structure and shape of real-world environments intricately and accurately. However, acquiring high-quality data poses many challenges that can impede the progress of large projects. Imaging is hindered by the cost of obtaining and operating equipment such as drones and LiDAR sensors. Point clouds often need to be preprocessed which requires substantial effort and expertise. In the forestry domain, segmenting individual trees is typically required for subsequent feature extraction and analysis, adding to the complexity of this task. As raw data is a prerequisite for most tasks, data acquisition can become a major bottleneck if not handled properly (See 5).
For this purpose, we developed an application that generates high-quality point clouds of synthetically produced forests quickly and cost-efficiently (see Figure 1). Our goal is to enable researchers to produce as much data as desired with customizable forest configurations that resemble target forest environments. By simulating forest growth in ForestFactory, building an artificial 3D forest environment using real tree models and simulating a LiDAR sensor in Helios++, we aimed to produce synthetic datasets that resemble real data as closely as possible. With SynForest, we hope that researchers can preprocess and analyze the data, prepare workflows, and pretrain deep learning models much more efficiently than acquiring real data.
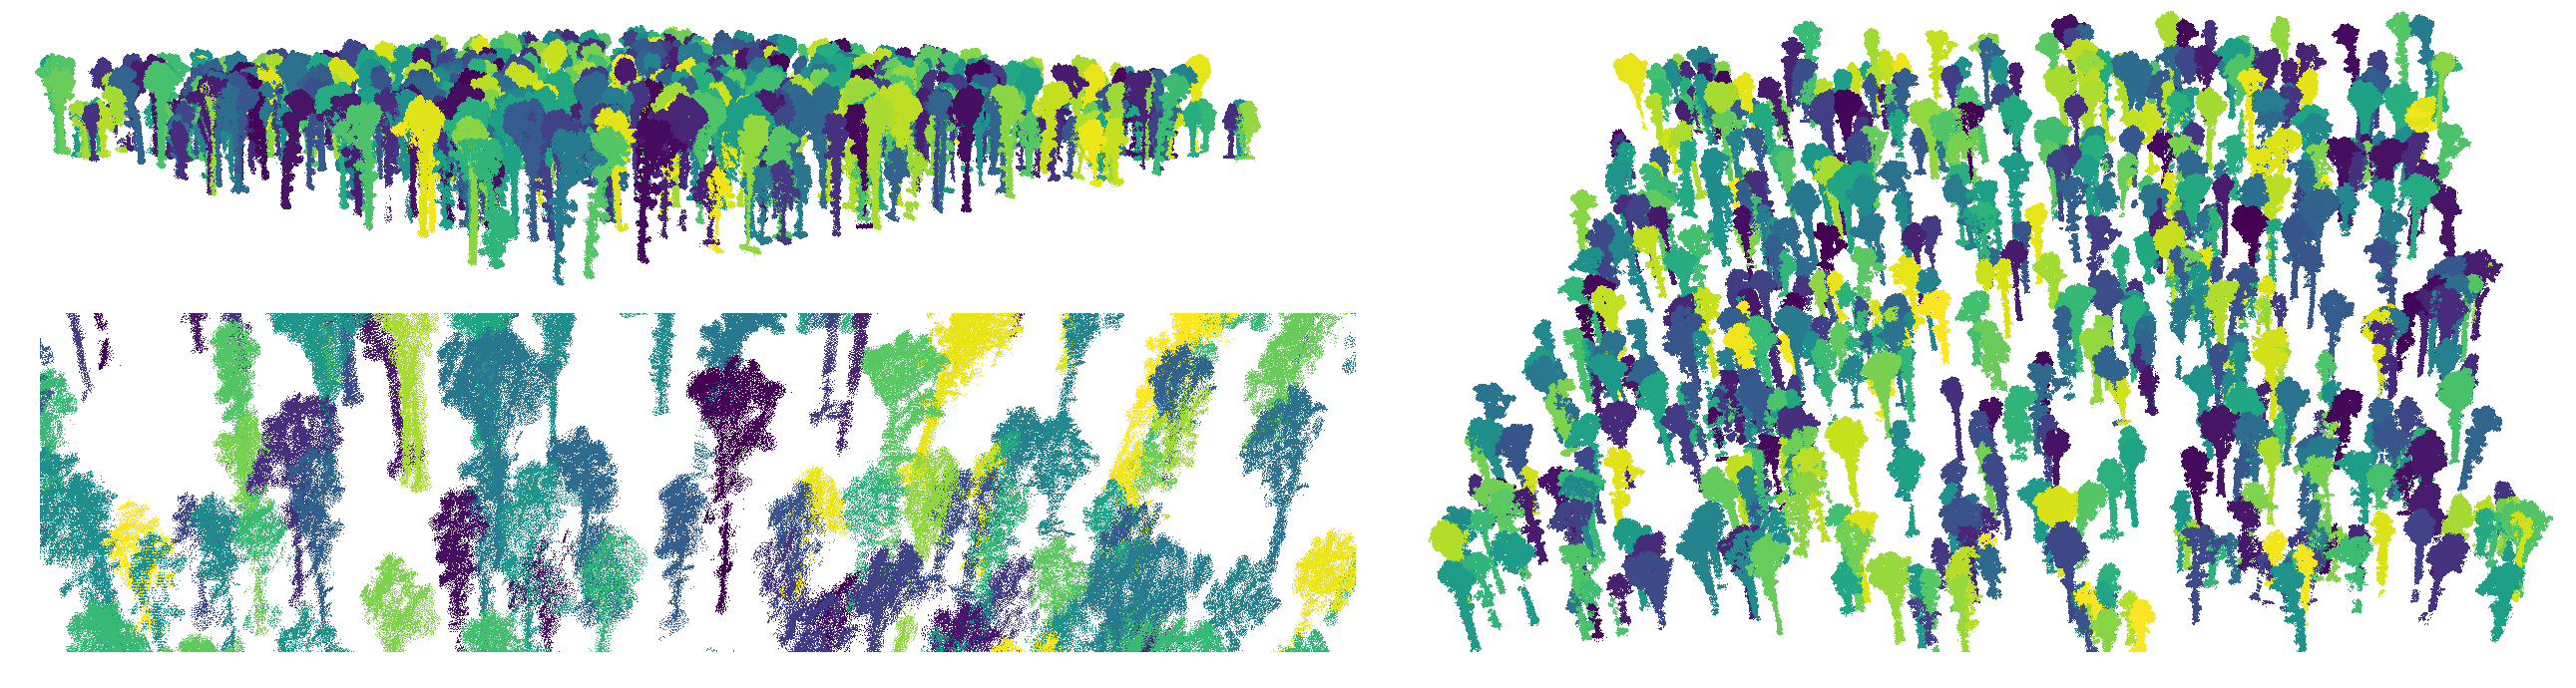 Figure 1. Example of a forest point cloud produced with SynForest. Individual trees are colored randomly.
Top-left: Side view, Bottom-left: Zoomed in, Right: Full view
Method
The synthetic forest production is divided into three main steps: Map, Scene, and Simulation. A JSON configuration file is used to determine the settings of each step (see Figure 2).
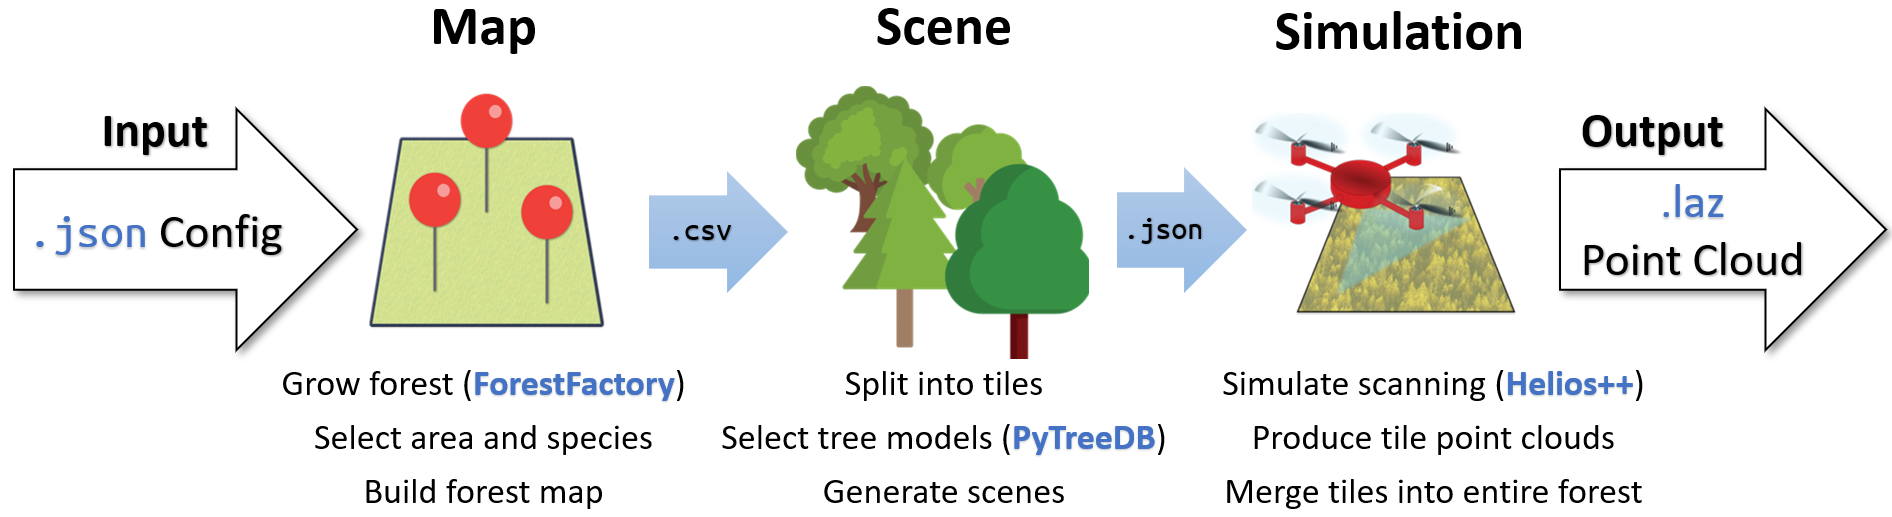 Figure 2. Overview of steps involved in SynForest’s workflow
Map
During the map step, a relatively simple map of the forest is produced, containing the coordinates, heights, and diameters, and species of the trees in the forest.
An initial forest map is produced using ForestFactory. ForestFactory uses climate records to simulate the growth of trees over a period of several years and incorporates interactions between the trees. The result is a tabular data file containing the position, height, species, and diameter of each tree in the forest. ForestFactory can produce forests with several tree species and variable densities. With appropriate climate records, it is possible to simulate forest growth in any environment.
The initial map produced by ForestFactory is then preprocessed to select the target area and species as stated in SynForest’s configuration file. The result of this step is a CSV file consisting of the positional information for each individual tree in the forest map (see Table 1). At this point, the global structure of the forest is determined, but the individual tree shapes are unknown, except for general information, e.g., the tree’s height and diameter.
| Tree ID | X | Y | Diameter | Height | Species |
|---|---|---|---|---|---|
| 1 | 3.2266 | 39.0349 | 0.4137 | 34.4867 | FagSyl |
| 2 | 45.1323 | 103.0373 | 0.5894 | 44.1235 | PicAbi |
| 3 | 84.5816 | 76.3333 | 0.4564 | 35.9486 | FagSyl |
| 4 | 155.5193 | 134.1912 | 1.2078 | 37.7912 | QueRub |
| 5 | 53.9892 | 33.8612 | 0.2593 | 26.0365 | QuePet |
Table 1. Example of data rows produced in map step
Scene
In the scene step, the 3D forest environment is fully determined, including the precise shapes and models of the trees. The forest is split into several smaller tiles for the purpose of parallelization, and a JSON scene file is produced for each tile, describing the 3D models and orientations for each tree.
Taking the forest map produced in the previous step as input, the target area is tiled according to the settings in the configuration file. The tiles may overlap with each other by a specified amount, to prevent edge case artifacts on borders.
Within each tile, three-dimensional tree models are placed at their corresponding positions. To find a suitable model for each tree, its species, height, and diameter are considered as described in the forest map. SynForest then searches for the closest match in a database of real tree point clouds, e.g., PyTreeDB. Trees can be chosen with or without leaves and the minimum scanning quality can be set in the configuration file. The models may also be scaled or randomly rotated if desired. The final 3D model of each tree is then placed in the tile’s scene file.
Once the scene files are generated, an XML file is produced for each scene for the purpose of simulation in Helios++.
Simulation
In the third and final step, simulation, the individual tile scene files are loaded in parallel on multiple HPC nodes, and by simulating the imaging method, high-quality point clouds are generated for each tile.
Using the flight path and the sensor’s parameters as determined in SynForest’s configuration file, the corresponding XML survey files are created for simulation with Helios++. A job array is submitted using Slurm to run Helios++ in parallel and produce a point cloud for each tile.
When all simulations are completed, the point clouds are merged into a single point cloud, excluding the overlapping points to prevent multiple occurrences on the tile borders. The points have many features, including intensity, return number, and tree ID. Along with the final point cloud, a complementary CSV file is produced that describes the individual trees and their features, which can be used to select desirable points in the point cloud.
Usage
The installation guide is available in SynForest’s repository 6. Once SynForest is installed, it can be run simply with:
python run.py config/example_ULS.json
The script loads the configuration file in the argument and submits a number of slurm jobs. Depending on the forest size, configuration, and available nodes, the task may take several minutes or hours.
Once the final job is completed, a full-size point cloud (see Figure 3) and its complementary CSV file will be stored in the results folder.
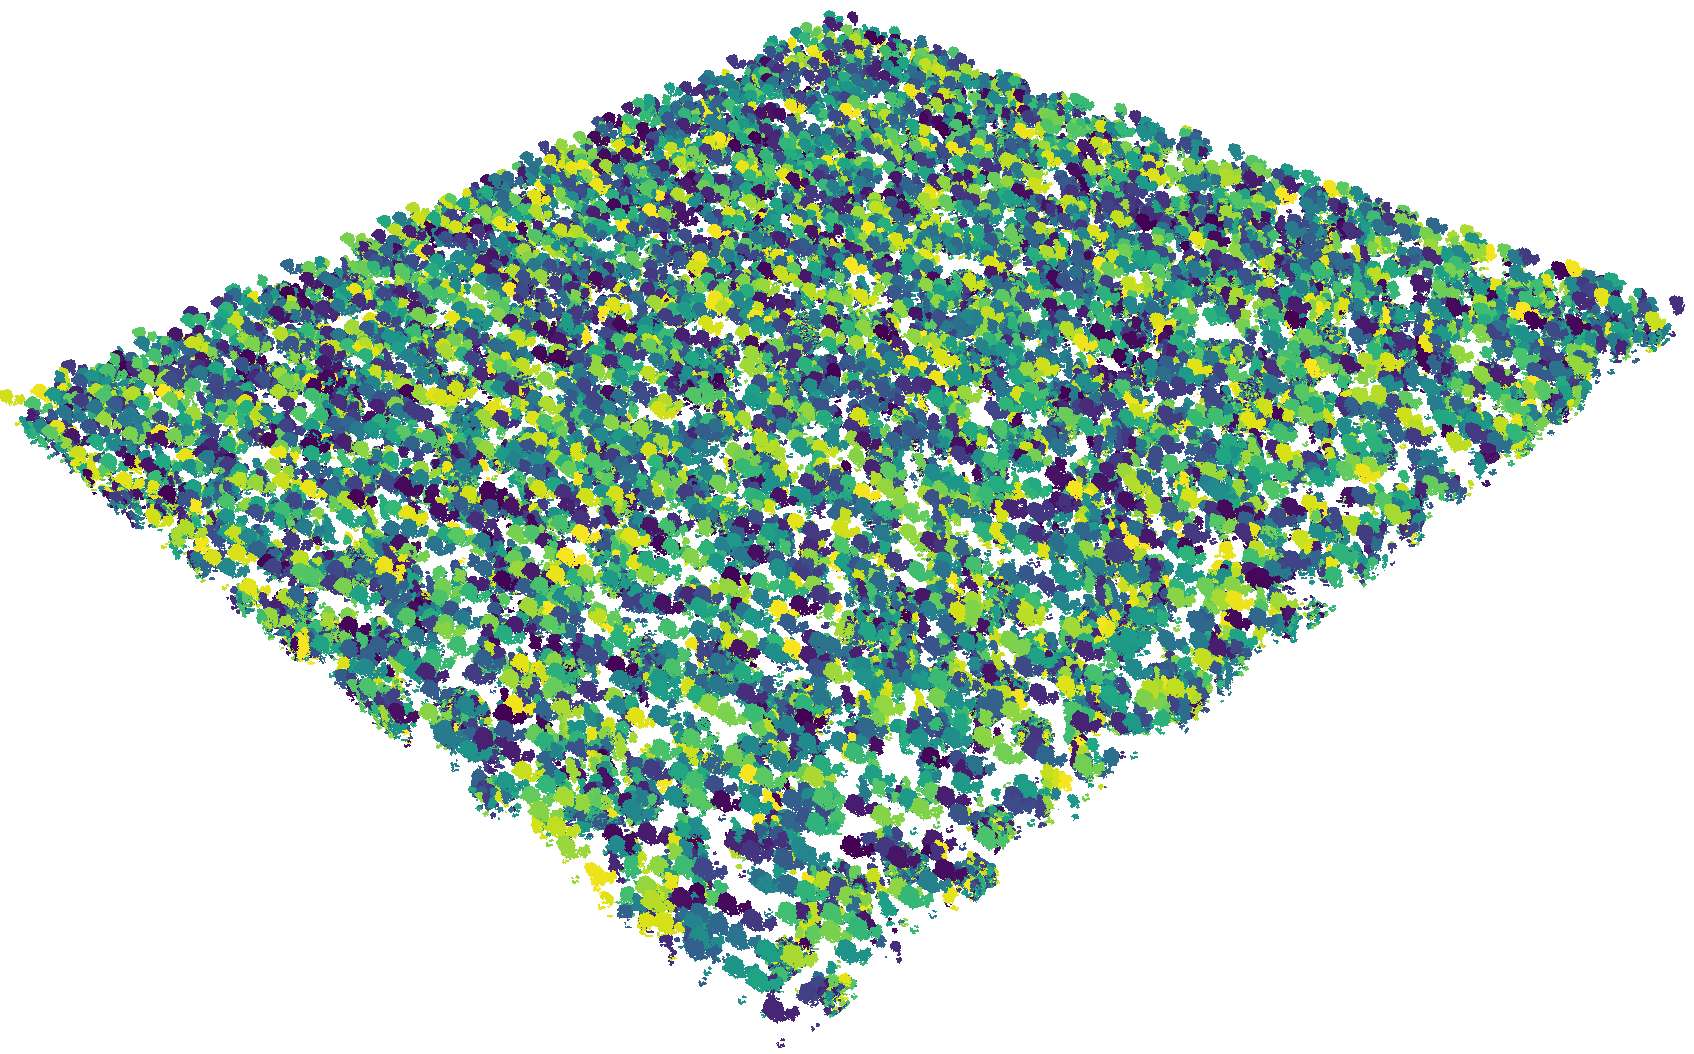 Figure 3. 1000 x 1000 m2 synthetic forest with 37915 trees and approx. 110 million points (1.7 GB)
Configuration
Many parameters can be adjusted in SynForest by specifying them in the configuration file. A few notable parameters are shown in Table 2. A detailed explanation of all configurable parameters can be found at 7.
| Parameter | Description |
|---|---|
side |
Side length of the square map in meters |
species |
Identifier(s) of the tree species, e.g. QuePet |
tile_w, tile_h |
Width and height of each tile in meters |
tile_overlap |
The overlap between adjacent tiles in meters |
platform |
ID, speed, and altitude of simulated platform (e.g., drone or plane) used for the survey |
scanner |
ID and parameters of simulated lidar sensor (e.g., Zenmuse L1) |
Table 2. Notable configurable parameters of SynForest
Applications
As a data synthesis tool, SynForest has endless applications. Owing to its simple usage and efficiency, it is possible to produce many large datasets rapidly. These synthetic datasets can be used as an alternative to real data for various purposes.
In machine learning and deep learning, SynForest can be used to generate datasets for developing pipelines and pretraining models for a variety of forestry tasks. Since each point in the point cloud has a tree ID, its species and other tree features can be extrapolated using the complementary CSV file. Therefore, the datasets can be used to train and evaluate segmentation and classification models.
The data is also suitable for forest analysis. Since accuracy and realism is a priority in every step of SynForest’s workflow, the resulting files are comparable to real forest data. For analysis tasks where sufficient data cannot be obtained directly, it is possible to produce similar forests using only the target’s climate records as an approximation to real data. Furthermore, the parameters in the configuration file can be altered to produce custom forests with different species and densities. To obtain a synthetic forest with a specific shape, one can simply produce a larger square with SynForest and then select the trees within the desired shape.
SynForest’s large data output and job parallelism can also be taken advantage of for system benchmarking and enhancement.
SynForest is available at 6.
Acknowledgements
-
GWDG News Article: https://gwdg.de/about-us/gwdg-news/2023/GN_9-10-2023_www.pdf ↩
-
ForestFactory https://git.ufz.de/angermue/forestfactory ↩
-
PyTreeDB: https://pytreedb.geog.uni-heidelberg.de/ ↩
-
Helios++: https://github.com/3dgeo-heidelberg/helios ↩
-
Janika Schäfer et al.: “Applications of synthetic airborne laser scanning data of forests”, ForestSat Conference 2022. ↩
-
SynForest https://gitlab-ce.gwdg.de/hpc-team-public/synforest ↩ ↩2
-
SynForest Configuration https://gitlab-ce.gwdg.de/hpc-team-public/synforest/-/blob/main/docs/CONFIG.md ↩